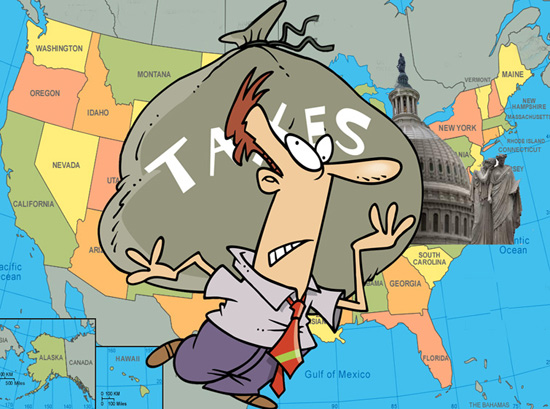
Each April, Uncle Sam claims a portion of the previous year’s earnings. Because the tax code is so complex, it can be difficult for the average person to understand exactly how they’re affected. One helpful measure that simplifies things is the “tax burden.” Unlike tax rates, which can differ significantly depending on an individual’s situation, tax burden looks at the share of total personal income that residents pay in state and local taxes. This burden isn’t the same across the United States.
“It’s easy to be dismayed at tax time when you see just how much of your income you lose. Living in a state with a low tax burden can alleviate some of that stress. Some states charge no income tax or no sales tax, although all states have some form of property taxes and excise taxes,” said Chip Lupo, WalletHub Analyst

To identify where residents face the highest tax burdens, WalletHub compared all 50 states by examining three major types of state tax burdens—property taxes, individual income taxes, and sales and excise taxes—and calculating their cost as a percentage of total personal income in each state.
Overall Tax Burden by State
| Overall Rank* | State | Total Tax Burden (%) | Property Tax Burden (%) | Individual Income Tax Burden (%) | Total Sales & Excise Tax Burden (%) |
| 1 | Hawaii | 13.30% | 2.62% (25) | 3.20% (7) | 7.48% (1) |
| 2 | New York | 12.39% | 4.22% (4) | 4.65% (2) | 3.53% (23) |
| 3 | Vermont | 11.10% | 4.89% (1) | 2.75% (14) | 3.46% (26) |
| 4 | New Mexico | 10.75% | 2.22% (36) | 2.25% (28) | 6.28% (3) |
| 5 | Maine | 10.01% | 3.95% (5) | 2.71% (15) | 3.35% (29) |
| 6 | Illinois | 9.92% | 3.75% (6) | 2.40% (24) | 3.77% (18) |
| 7 | Maryland | 9.70% | 2.54% (29) | 4.28% (3) | 2.88% (40) |
| 8 | New Jersey | 9.52% | 4.38% (2) | 2.42% (22) | 2.72% (43) |
| 9 | Oregon | 9.46% | 2.96% (17) | 4.76% (1) | 1.74% (46) |
| 10 | Rhode Island | 9.29% | 3.67% (7) | 2.16% (30) | 3.47% (25) |
| 11 | California | 9.24% | 2.89% (20) | 3.03% (11) | 3.32% (30) |
| 12 | Iowa | 9.21% | 3.32% (12) | 2.36% (27) | 3.53% (22) |
| 13 | Kansas | 9.20% | 2.92% (19) | 2.40% (23) | 3.87% (17) |
| 14 | Indiana | 9.12% | 2.15% (38) | 3.05% (10) | 3.91% (14) |
| 15 | Minnesota | 9.08% | 2.47% (32) | 3.34% (6) | 3.27% (33) |
| 16 | Ohio | 9.05% | 2.62% (24) | 2.54% (19) | 3.88% (16) |
| 17 | Connecticut | 9.00% | 3.66% (8) | 2.69% (16) | 2.65% (44) |
| 18 | West Virginia | 8.89% | 2.10% (39) | 2.87% (13) | 3.92% (13) |
| 19 | Utah | 8.87% | 2.21% (37) | 2.92% (12) | 3.73% (20) |
| 20 | Mississippi | 8.84% | 2.59% (26) | 1.65% (38) | 4.60% (8) |
| 21 | Massachusetts | 8.82% | 3.33% (11) | 3.45% (5) | 2.04% (45) |
| 22 | Louisiana | 8.82% | 1.84% (45) | 1.73% (37) | 5.25% (5) |
| 23 | Kentucky | 8.76% | 1.95% (41) | 3.15% (8) | 3.66% (21) |
| 24 | Pennsylvania | 8.47% | 2.59% (27) | 2.65% (17) | 3.23% (34) |
| 25 | Washington | 8.47% | 2.47% (31) | 0.13% (43) | 5.87% (4) |
| 26 | Arkansas | 8.44% | 1.59% (49) | 1.81% (35) | 5.04% (6) |
| 27 | Nevada | 8.37% | 2.09% (40) | 0.00% (45) | 6.28% (2) |
| 28 | Virginia | 8.26% | 2.92% (18) | 2.58% (18) | 2.75% (42) |
| 29 | Nebraska | 8.16% | 3.22% (14) | 2.11% (31) | 2.82% (41) |
| 30 | Georgia | 8.15% | 2.68% (23) | 2.51% (20) | 2.97% (38) |
| 31 | Wisconsin | 8.12% | 2.84% (21) | 2.39% (25) | 2.89% (39) |
| 32 | Michigan | 7.98% | 2.99% (16) | 2.00% (32) | 2.99% (37) |
| 33 | Alabama | 7.93% | 1.40% (50) | 2.17% (29) | 4.36% (9) |
| 34 | Missouri | 7.84% | 2.35% (33) | 2.38% (26) | 3.11% (35) |
| 35 | North Carolina | 7.81% | 1.92% (44) | 2.49% (21) | 3.41% (27) |
| 36 | Texas | 7.69% | 3.43% (9) | 0.00% (45) | 4.27% (11) |
| 37 | Colorado | 7.56% | 2.77% (22) | 1.43% (39) | 3.36% (28) |
| 38 | South Carolina | 7.49% | 2.56% (28) | 1.86% (33) | 3.07% (36) |
| 39 | Montana | 7.29% | 3.04% (15) | 3.05% (9) | 1.20% (48) |
| 40 | Arizona | 7.24% | 1.95% (42) | 1.01% (40) | 4.28% (10) |
| 41 | Oklahoma | 7.05% | 1.78% (46) | 1.78% (36) | 3.50% (24) |
| 42 | Idaho | 7.04% | 1.92% (43) | 1.84% (34) | 3.29% (31) |
| 43 | North Dakota | 7.02% | 2.23% (35) | 0.88% (41) | 3.91% (15) |
| 44 | Wyoming | 6.70% | 3.42% (10) | 0.00% (45) | 3.28% (32) |
| 45 | South Dakota | 6.38% | 2.32% (34) | 0.00% (45) | 4.06% (12) |
| 46 | Delaware | 6.28% | 1.67% (47) | 3.62% (4) | 0.98% (49) |
| 47 | Florida | 6.27% | 2.52% (30) | 0.00% (45) | 3.74% (19) |
| 48 | Tennessee | 6.21% | 1.60% (48) | 0.00% (44) | 4.61% (7) |
| 49 | New Hampshire | 5.38% | 4.33% (3) | 0.13% (42) | 0.91% (50) |
| 50 | Alaska | 4.92% | 3.32% (13) | 0.00% (45) | 1.60% (47) |