
In the vast expanse of Oklahoma’s rural heartland, where amber waves of grain meet endless horizons, the county road network serves as the unsung lifeline connecting farms to markets, families to schools, and communities to the world beyond. Spanning 82,960 miles – enough to circle the Earth more than three times – these roads and bridges bear the weight of daily life for millions of Oklahomans. Yet, beneath the surface of this critical infrastructure lies a story of systemic neglect: a funding system that funnels the lion’s share of transportation taxes to the state’s general fund and the Oklahoma Department of Transportation (ODOT), leaving counties scraping by with fractions of what they need.

This investigative report delves into the disparities in state funding for county road and bridge maintenance, drawing on official documents, expert analyses, and economic data to expose the gaps. It also explores what a fairer, asset management-based approach might look like, calculating the true costs of maintaining gravel and paved roads and proposing models for equitable distribution.
The Funding Mirage: How Taxes Flow Away from Counties
Oklahoma’s county roads are primarily funded through five key state excise taxes: gasoline, diesel, special fuels, gross production (on oil and gas), and motor vehicle license and registration fees. These taxes, collected by the Oklahoma Tax Commission (OTC), generate hundreds of millions annually, but only a sliver trickles down to the counties responsible for maintaining the bulk of the state’s road mileage. In fiscal year 2020, for instance, the total state investment in county roads and bridges amounted to $386 million – a figure that represents just 35% of all state transportation spending, despite counties managing over 80,000 miles of roads compared to ODOT’s 12,257 center-line miles of state highways.
Breaking it down by tax source reveals the stark imbalance.
Take the gasoline tax, levied at 17 cents per gallon (16 cents excise plus a 1-cent assessment). After deductions for tribal shares, aeronautics, and education funds, only about 27% goes to counties via the County Highway Fund, with an additional 5.75% directed to the County Bridge and Road Improvement (CBRI) Fund. The bulk – 63.75% – flows to the State Transportation Fund, which primarily benefits ODOT’s highway projects, while 1.625% lands in the state’s general revenue fund.
Diesel taxes follow a similar pattern: 26.58% to counties, 3.85% more via CBRI, but 64.34% to the State Transportation Fund and 1.39% to general revenue.
Special fuels and gross production taxes allocate even smaller shares to counties – around 26.6% and 7.14%, respectively, with the majority supporting state-level priorities or the general fund.
The County Improvements for Roads and Bridges (CIRB) program, created by House Bill 1176 in 2006, offers a dedicated pot from motor vehicle fees, capped at $120 million annually until recent increases (rising to $150 million by 2027). Yet even this is fragmented: 25% goes back to the County Highway Fund, and the rest is divided among ODOT’s eight field divisions, often prioritizing bridges over routine maintenance. In total, state appropriations to counties hovered around $312 million to $351 million in 2019-2020, supplemented by federal funds like the Surface Transportation Block Grant Program ($28.5 million annually for bridges and roads) and local sources such as county sales taxes ($64 million in 2022 from 29 counties).
This allocation structure, rooted in legislation dating back to the 1980s, has created a persistent disparity. While ODOT enjoys stable funding for its 30,000 lane miles – including $2.5 billion in the 2025 budget – counties must stretch their dollars across 82,960 miles, where 70% are paved and 30% unpaved (mostly gravel). The result? Funding per mile varies wildly: in 2019, Oklahoma County received $24,017 per mile, while rural Tillman County got just $1,851, averaging $4,239 statewide (or $3,837 excluding the largest counties). This inequity exacerbates rural-urban divides, with smaller counties unable to afford basic upkeep, leading to deteriorating infrastructure.
Compounding the issue is the state’s history of stagnant motor fuel taxes, unchanged since 1987 for gasoline, amid rising construction costs and inflation. A 2023 Road User Charge Task Force report highlighted how vehicle revenues are not fully dedicated to roads, with portions siphoned to the general fund, perpetuating this under-funding model. Meanwhile, one in five county bridges is deficient or obsolete, costing an estimated $850 million to fix, with counties like Ottawa (38% deficient) and Pawnee (32%) hit hardest. As one county commissioner lamented in a 2020 Senate presentation, maintaining 27 miles with $103,599 is “unsustainable” when factoring in payroll, equipment, fuel, and materials.
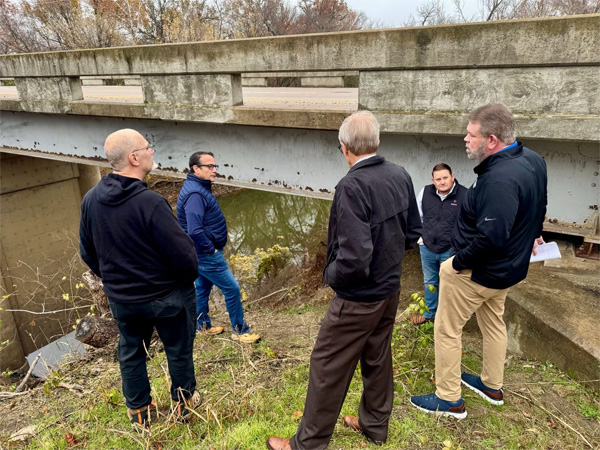
The True Cost
What Asset Management Reveals About Maintenance Needs
To understand the depth of the funding gap, we must shift to an “asset management” model, a data-driven approach that assesses roads based on condition, usage, lifespan, and maintenance requirements, rather than arbitrary tax splits. ODOT already employs such a model in its Transportation Asset Management Plan (TAMP), which forecasts long-term needs for pavements and bridges to achieve a “state of good repair.” Extending this to counties could revolutionize funding, prioritizing preventive maintenance to extend asset life and reduce costly replacements.
But what does it “really” cost to maintain a mile of county road? Drawing on national and regional studies, annual maintenance for gravel roads, which involve grading, drainage, dust control, and resurfacing, averages around $4,661 per mile per year in “needed” funding to keep them functional and safe. This includes routine activities like reshaping and gravel replacement, but escalates in Oklahoma’s variable terrain and weather, where hauling gravel can add $25,000-$30,000 per mile for initial surfacing. For paved roads, which require patching, sealing, and periodic resurfacing, the needed annual cost jumps to $19,983 per year per mile, accounting for higher traffic loads and materials like asphalt ($200,000 per mile to lay). These figures align with broader U.S. averages for paved road cost, but the “needed” estimates reflect full asset preservation, including erosion control and safety upgrades.
Applying these to Oklahoma’s network: With 24,888 miles of gravel roads (30% of total), proper maintenance would require approximately $116 million annually (24,888 × $4,661). For the 58,072 paved miles (70%), the tab rises to $1.16 billion (58,072 × $19,983). Total: roughly $1.276 billion per year – more than triple the $386 million in state funding provided in FY20. Even conservative estimates (e.g., $3,000 for gravel, $7,000 for paved) yield $581 million needed, still far exceeding current allocations. Bridges add another layer: replacing a short-span structure costs $450,000, and with 1 in 12 county bridges unable to support a school bus, the backlog could balloon to $811 million for structurally deficient ones alone.
Under an asset management model, counties could receive funding calibrated to these real costs, potentially closing the gap. The Legislative Office of Fiscal Transparency (LOFT) and Senate recommendations advocate for monthly allocations based on resource models that factor in condition ratings, vehicle miles traveled, and terrain – similar to the existing County Road (CR) Factor used for CBRI disbursements. This would shift from ODOT’s division-based cash pooling and state agency control to direct county control, allowing flexible use for preventive work.
Rethinking Allocation: Miles by Type, or a Smarter Metric?
Should funding be based solely on total road miles by type? It’s a start, but incomplete. A pure mileage model, e.g., $4,661 per gravel mile and $19,983 per paved, would allocate $116 million for gravel and $1.16 billion for paved statewide, distributed proportionally to each county’s inventory. For example, Rogers County, with over 1,092 paved miles, would claim a larger share than smaller, gravel-heavy counties. However, this ignores variables like traffic volume, soil type, and bridge density, which inflate costs in rural areas.
A hybrid asset management approach, as proposed in ODOT’s TAMP and CIRB reforms, is superior: Base funding on miles by type, then adjust via a weighted formula incorporating condition scores (e.g., pavement ratings from “poor” to “good”), daily vehicle miles, terrain (hilly vs. flat), and bridge factors. This mirrors the CR Factor, which already weighs collector miles and terrain for CBRI funds. Such a model could increase total state contributions to $1 billion+ annually, fully dedicating fuel taxes to transportation (as urged by the 2023 task force) and reducing general fund diversions. Federal boosts, like the $930 million over five years in the 2025-2029 plan for 230 bridges and 1,000+ road miles, could supplement, but state reform is essential.

The Road Ahead: Calls for Reform Amid Political Inertia
Interviews with county officials and reviews of legislative reports paint a picture of frustration. “We’ve been putting $120 million a year into county roads, but it’s not enough,” noted a 2022 Senate budget breakdown, amid calls for incremental increases. Yet, tax cuts and competing priorities, from education to prisons, have worsened inequality, as a 2024 OK Policy report warns. A new $75 million fund in 2025 offers hope for deficient bridges, but it’s a band-aid on a sucking chest wound. Ultimately, Oklahoma’s county roads embody a broader failure: a state rich in energy resources yet poor in infrastructure equity. By adopting asset management and reallocating taxes, lawmakers could bridge the divide, ensuring safe passage for generations. Without action, the cracks will only widen – literally and figuratively.
About the author: Marven Goodman publishes “The Sooner Sentinel” on Substack and invites readers to subscribe for free at this link which is where this story first appeared today. Goodman is a former Logan County Commissioner, and retired Army Lieutenant Colonel with a passion for digital electronics and computer science. His career began in 1973 as a U.S. Marine Corps avionics bench technician, troubleshooting circuits and exploring binary logic. He earned a Bachelor of Science in Education from the University of Central Oklahoma in 1993, blending military training with computer science studies.
Goodman served as Chief Information Officer on the Oklahoma Adjutant General’s staff and retired from the military in May 2000. First elected as Logan County Commissioner in June 2014, he served through January 2023, bringing his technical and leadership expertise to writing, governance, and public service.