
Oklahoma saw a 20.2% decline in its manufacturing employment between 2000 and 2024. This translates to a loss of 35,569 jobs during that period. Federal Reserve Bank of St. Louis new data released August 1 shows U.S. manufacturing employment continued to fall in July 2025—reaching its lowest level since April 2022—even as billions of dollars pour into new plants and reshoring initiatives nationwide.
While policymakers often cite job creation as a central goal of bringing manufacturing back home, today’s highly automated factories mean employment is unlikely to return to past levels. U.S. manufacturing jobs have declined sharply over the past two decades, even as output has grown and Oklahoma’s manufacturing GDP increased by 10.6% over the same span.

For context, the nation as a whole saw a loss of over 4.5 million manufacturing jobs since 2000 (-26%), while real manufacturing GDP grew by 45%—revealing a sharp disconnect between employment and output.
After decades of offshoring, the United States is attempting a manufacturing revival. Under the Biden administration, federal programs like the CHIPS and Science Act, the Inflation Reduction Act, and the Infrastructure Investment and Jobs Act directed hundreds of billions toward reshoring critical industries. More recently, President Trump’s sweeping tariff agenda has added new pressure to relocate production back to U.S. soil.
Together, these policies aim to rebuild domestic capacity in high-priority sectors such as semiconductors, pharmaceuticals, and clean energy. Across the country, companies are pouring money into new factories and expansion projects, with federal leaders frequently touting job creation as a central outcome of this industrial strategy.
But while reshoring may help reverse some losses, it is unlikely to restore manufacturing employment to its former scale. The modern factory floor is leaner and more automated than in decades past. The number of U.S. workers employed in manufacturing has dropped sharply over the last two decades—even as output has continued to grow. To assess the full picture, researchers at ETQ—a quality management platform for the manufacturing sector—analyzed data from the U.S. Bureau of Labor Statistics (BLS) and the Bureau of Economic Analysis (BEA), examining how manufacturing jobs have changed nationwide since 2000, which sectors and states were hit hardest, and the disconnect between employment trends and output.
The Rise & Fall of U.S. Manufacturing Jobs
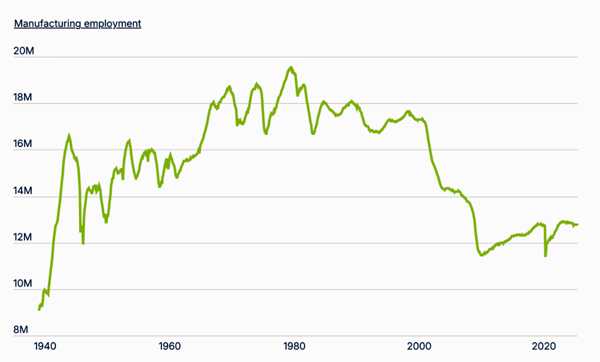
The U.S. shed over 4.5 million manufacturing jobs between 2000 and 2024
Source: ETQ analysis of U.S. Bureau of Labor Statistics data
U.S. manufacturing employment has followed a century-long arc—growing rapidly through the early 20th century, peaking in the late 1970s, and declining sharply in the decades that followed. From 1900 to 1945, industrial expansion and wartime production drove strong job growth. The postwar boom pushed manufacturing employment to a record 19.5 million workers in 1979, sustained by high demand and strong unionization.
From 1980 to 2000, U.S. manufacturing employment declined gradually as automation and rising global competition began to reshape industrial production. But between 2000 and 2010, job losses accelerated sharply—driven in large part by China’s entry into the World Trade Organization in 2001 and the ensuing “China Shock,” which triggered a wave of offshoring and plant closures across the U.S.
Since 2010, the sector has seen a modest recovery, but these efforts have not reversed long-term losses. Between 2000 and 2024, the U.S. shed over 4.5 million manufacturing jobs—a 26% decline—despite a 45% increase in real manufacturing GDP, according to the BEA. New technologies, automation, and process efficiencies have enabled producers to do more with fewer workers, underscoring a central tension in the reshoring debate: rebuilding industrial output doesn’t always mean rebuilding employment.
Manufacturing Job Losses by Sector
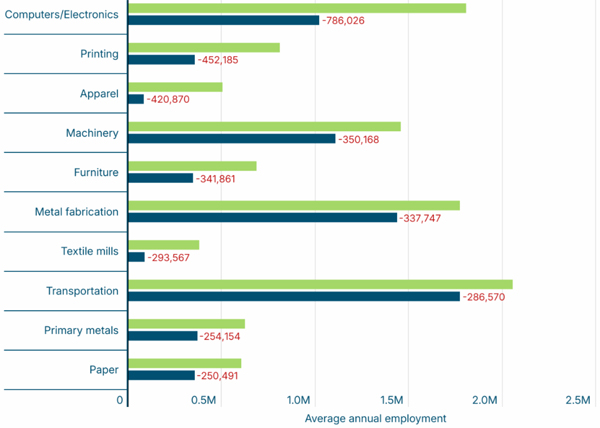
More than three-quarters of a million U.S. tech manufacturing jobs have disappeared since 2000
Source: ETQ analysis of U.S. Bureau of Labor Statistics data
Not all parts of the manufacturing economy have experienced the same level of job loss. Since 2000, employment in computer and electronic product manufacturing has fallen by 786,000 jobs, a decline of over 43%. Other sectors with substantial losses include printing and related support activities (-452,000), apparel manufacturing (-421,000), and machinery manufacturing (-350,000).
On the other hand, some sectors have remained more resilient. The food manufacturing sector and the beverage and tobacco product manufacturing sector are the only two to report job gains since 2000. These gains reflect increased domestic demand and relative insulation from offshoring, as many food-related manufacturing jobs remain tied to local agricultural supply chains and consumer markets.
States That Lost the Most Manufacturing Jobs
Rust Belt states, along with California and North Carolina, have lost the most manufacturing jobs.
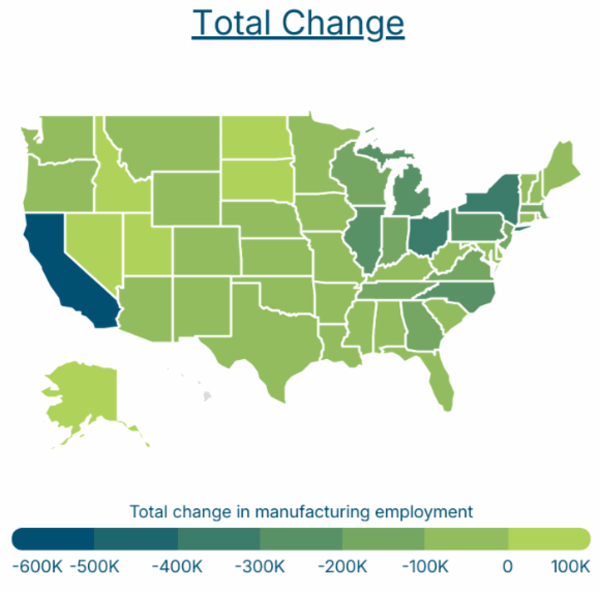
Manufacturing job losses have been most pronounced in the Northeast and Midwest, where many states were historically tied to heavy industry. When measured by percentage decline, the steepest losses occurred in the Northeast:
- New York saw a nearly 45% drop in manufacturing employment between 2000 and 2024, shedding more than 330,000 jobs.
- Rhode Island, Massachusetts, and Vermont also lost more than 40% of their manufacturing jobs during this period.
The states that reported the most total jobs lost were more geographically diverse, spanning the East Coast, Midwest, and California:
- California, the nation’s largest manufacturing state by output, lost nearly 615,000 jobs.
- Other major losses occurred in Ohio, New York, Pennsylvania, North Carolina, Illinois, and Michigan, each of which lost between 290,000 and 340,000 jobs.
Nationally, manufacturing employment fell by 26.5% between 2000 and 2024, even as overall private-sector employment grew by approximately 20%. Nevada stood out as the only state where manufacturing job growth exceeded the rate of overall job growth—driven largely by its expanding advanced manufacturing sector, including battery and electric vehicle production. A handful of other states—Utah, North Dakota, South Dakota, Idaho, and Alaska—also added manufacturing jobs during this period, though their growth trailed behind overall private-sector gains.
While most states lost manufacturing jobs between 2000 and 2024, nearly all saw gains in manufacturing output. All but four states experienced real, inflation-adjusted growth in manufacturing GDP over the period, highlighting a growing disconnect between employment and production.
As mentioned above, this divergence is driven by structural changes in the sector. New software, automations, and advanced manufacturing processes have reduced the need for manual labor, while high-value industries like pharmaceuticals, semiconductors, and aerospace generate substantial output with relatively few workers. As a result, many states have expanded their manufacturing economies without a corresponding increase in jobs—reflecting a broader shift toward capital-intensive, technology-driven production.
This trend is especially evident in states like Oregon, Arizona, Florida, and Texas, all of which more than doubled their manufacturing GDP during this period despite a net decline in manufacturing employment.
Here is a summary of the data for Oklahoma:
- Percentage change in manufacturing employment: -20.2%
- Percentage change in manufacturing GDP: +10.6%
- Percentage change in total employment: +16.1%
- Total change in manufacturing employment: -35,569
- Total manufacturing employment (2000): 176,357
- Total manufacturing employment (2024): 140,788
- Manufacturing as a share of total employment (2000): 15.1%
- Manufacturing as a share of total employment (2024): 10.4%
For reference, here are the statistics for the entire United States:
- Percentage change in manufacturing employment: -26.5%
- Percentage change in manufacturing GDP: +45.2%
- Percentage change in total employment: +20.4%
- Total change in manufacturing employment: -4,583,578
- Total manufacturing employment (2000): 17,314,423
- Total manufacturing employment (2024): 12,730,845
- Manufacturing as a share of total employment (2000): 15.7%
- Manufacturing as a share of total employment (2024): 9.6%
Methodology
Data for this analysis comes from the U.S. Bureau of Labor Statistics (BLS) Quarterly Census of Employment and Wages (QCEW) and the U.S. Bureau of Economic Analysis (BEA) GDP by State dataset. Changes were analyzed from 2000 to 2024. Only private-sector employment was included. Changes in GDP were inflation-adjusted using real chained-dollar values. Only states with complete data from both sources were included.